Stop logging into your various ticketing platforms to check each event. Showtool pulls everything into one place, no matter which ticketing provider you use or how many shows you're doing.
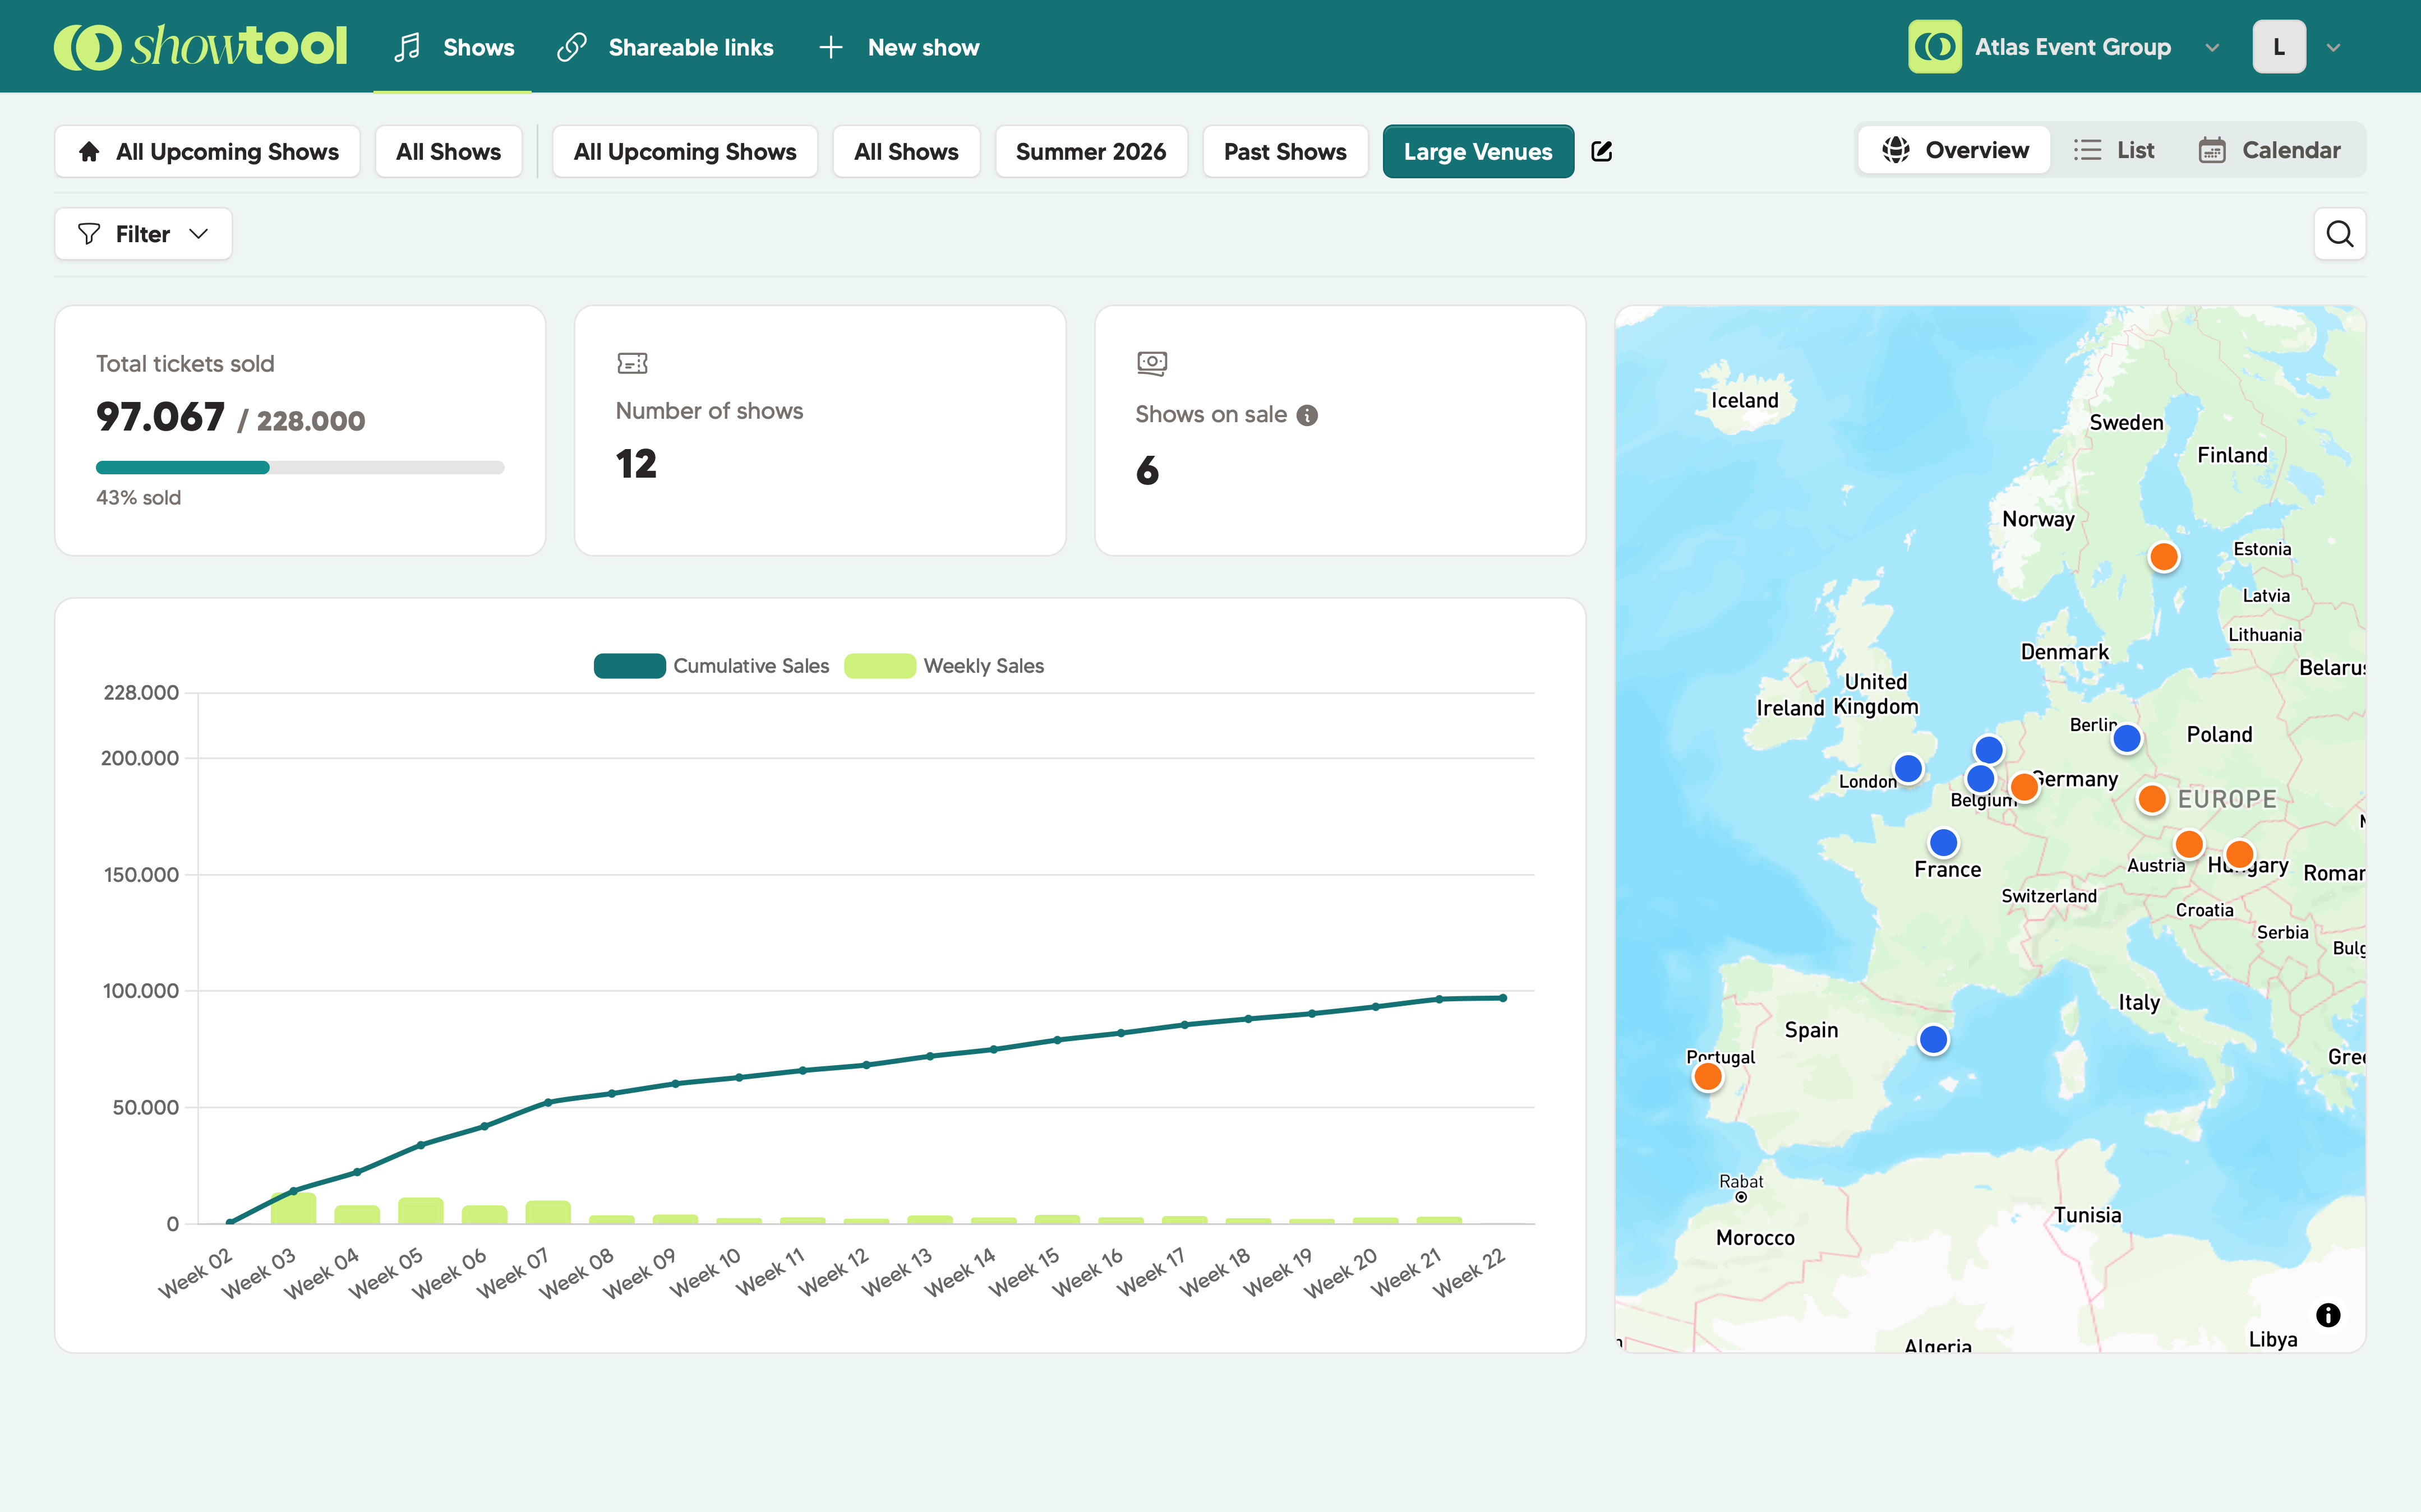
The dashboard opens to a stats overview: how many shows are on sale, how many tickets have been sold across your full portfolio, and total revenue - all updated automatically throughout the day.
No exports, no clicking around. The numbers are just there, the moment you open Showtool.
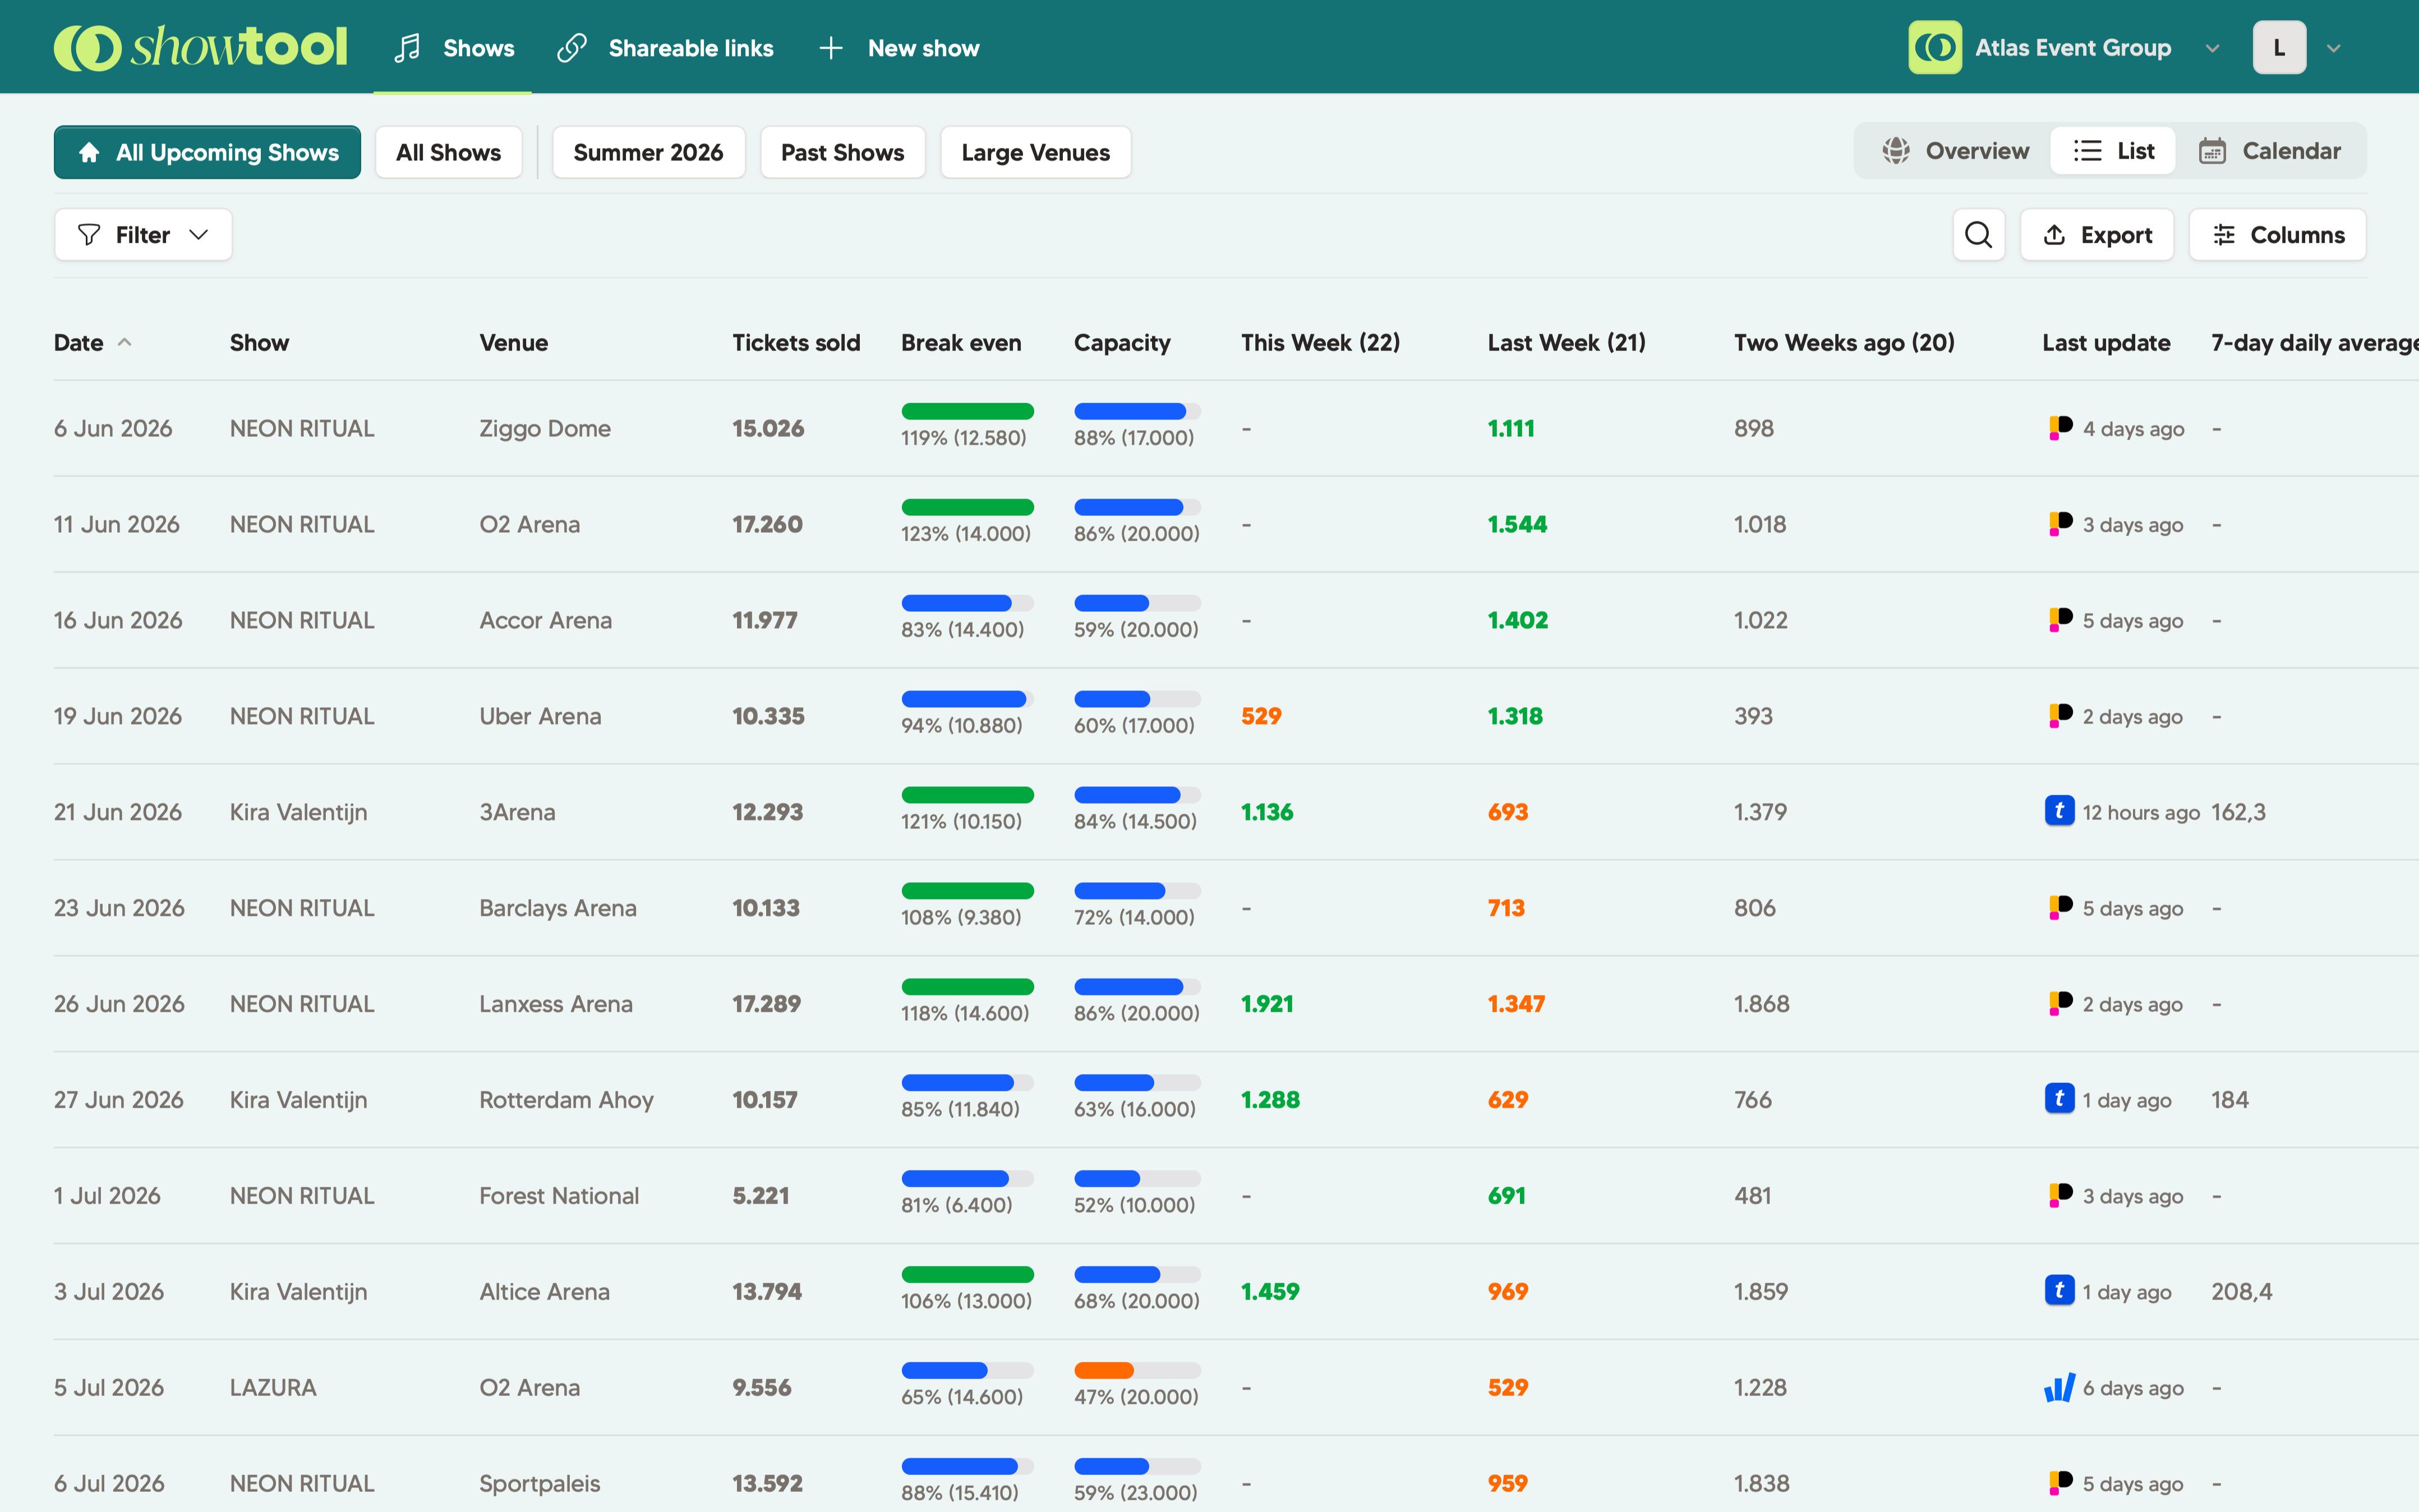
The list view shows every show in a table. The power comes from our filters & views, so you can combine certain shows or tours together. Also useful when you're working with a big team: the marketing managers can filter on 'their' shows only.
Each show is clickable and opens a detailed graph and show data.
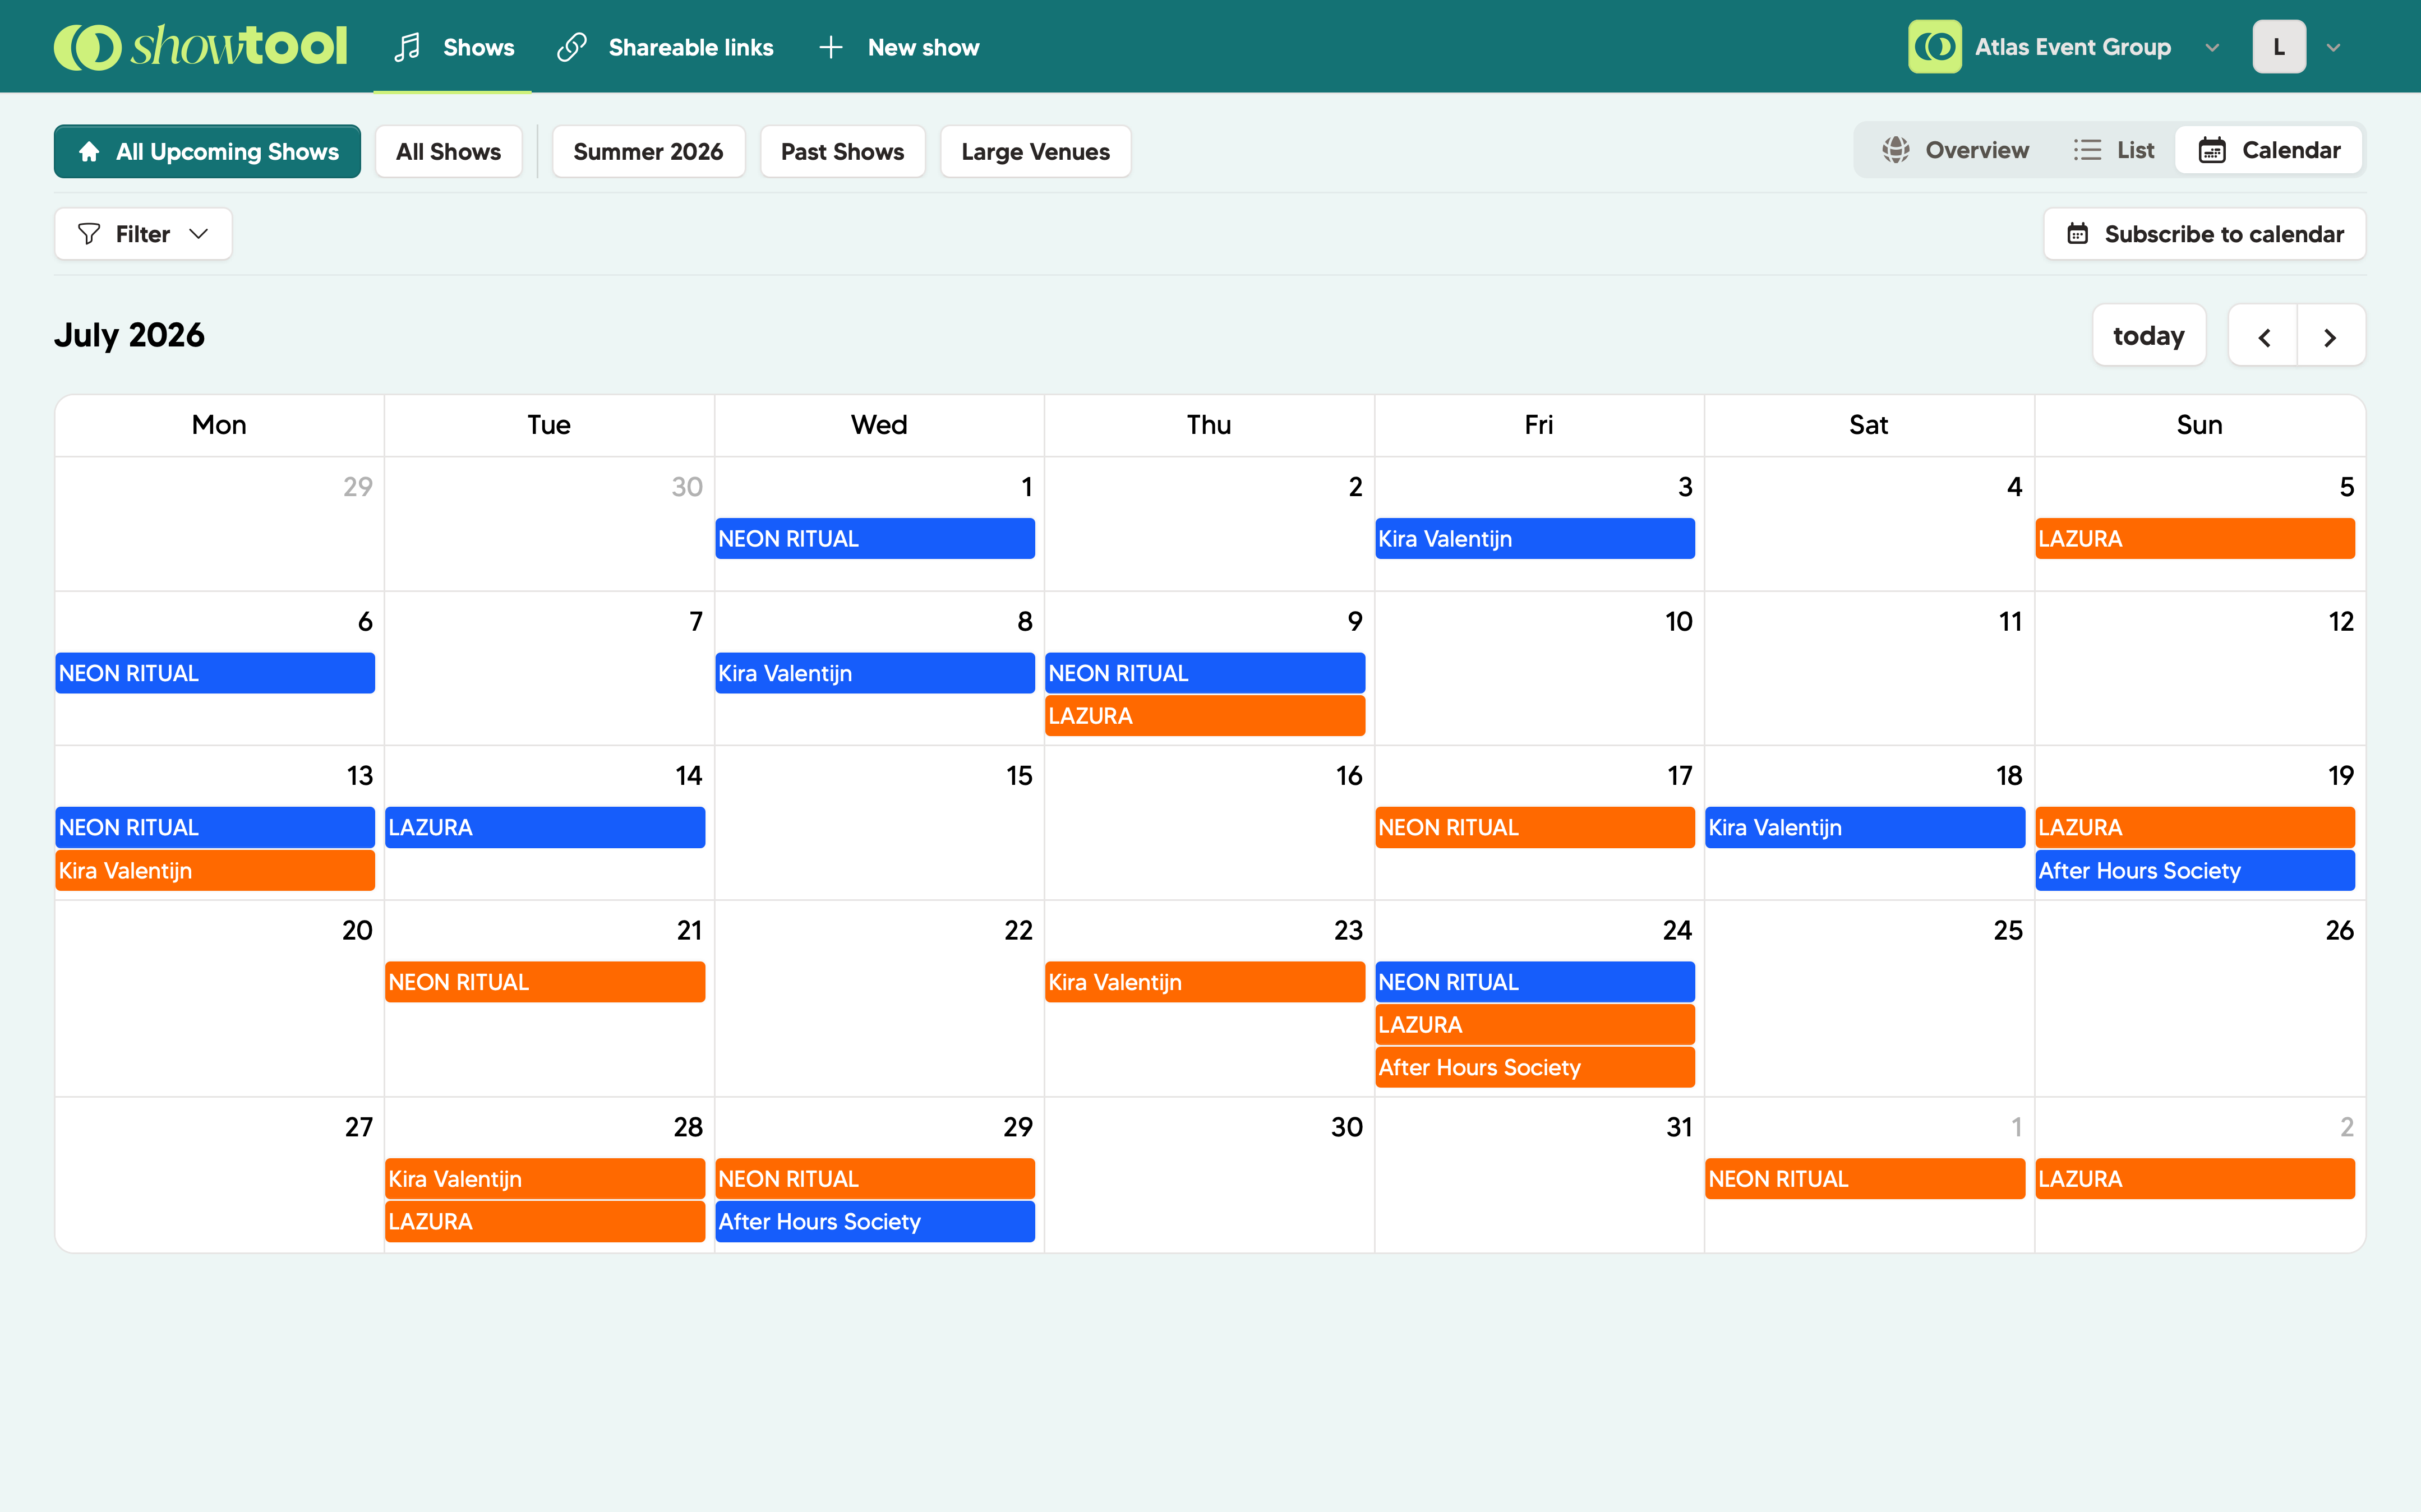
You're probably missing this in your current ticket provider, right? Switch to the calendar view to see your full programme laid out by month. See which weekends are busy, where gaps are, and how your shows are distributed across the year.
You can even use our .ics calendar integration to subscribe to all your shows in your own calendar app, on your smartphone and/or on your desktop.
See where all your shows are happening geographically. Our innovative map view plots every show by venue location. Useful for routing tours, spotting regional clusters, or just getting a quick overview of where you're most active.
Yes. Showtool lets you view your shows as a sortable list, a monthly calendar, or a map. Switch between them with one click, all views show the same live data.
The dashboard shows key stats like upcoming shows, total tickets sold, and revenue across your full portfolio. Stats update automatically whenever your ticketing integrations sync.
Yes. Invite as many team members as you need: there is no seat limit in Showtool. Everyone sees the same live data without needing separate logins to your ticketing platforms.
14-day free trial. No credit card needed. Connect your ticketing provider in minutes.